

Shear Testing Of Fibrous Materials
It is not practical to measure the shear strength of many bulk materials, especially biomass products, in a conventional Jenike or annular shear cell, so this paper is a useful contribution to the very awkward problem of measuring the failure properties of fibrous products. The cell shown essentially provides a wide shear plane that allows bending and separation of the interlocking fibres to overcome the problem of trying to shear the fibres themselves. The anistrotropic nature of fibrous materials and stress circumstances may induce variations in the shear strength, according to the manner of preparation of the sample and the characteristics of the failure zone that can be different from the test procedure. Some care, or a different relative cell gap clearance, may therefore be required to assess how closely the results replicate the conditions in different applications, for example the narrow shear plane associated with a change of direction in feeders extracting from a hopper, compared with bulk shear generated by compacting stresses occuring during mass flow in a hopper. ■

Flow Properties Measurement
Flow properties measurement for low-density bulk solids composed of non-spherical particles
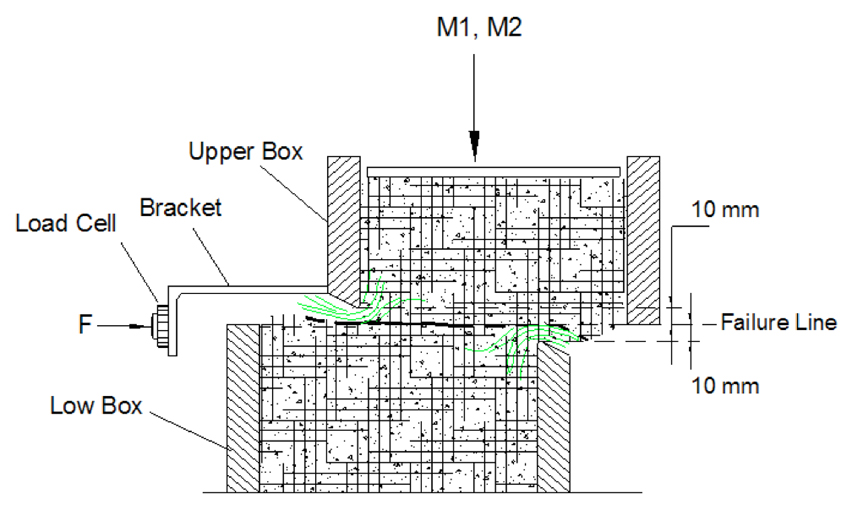
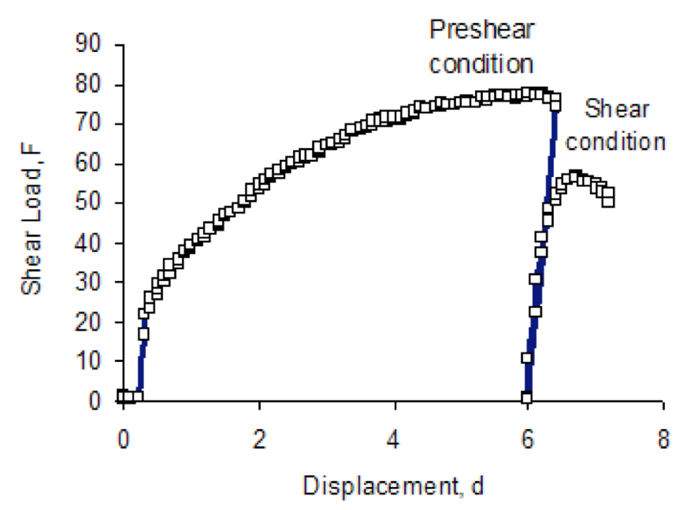
Figure 1a and 1b: Shear test device and failure plane on sugarcane bagasse pith (Escamilla, 2001; Escamilla, 2002)
Table 1: Testing plan to obtain the yield loci
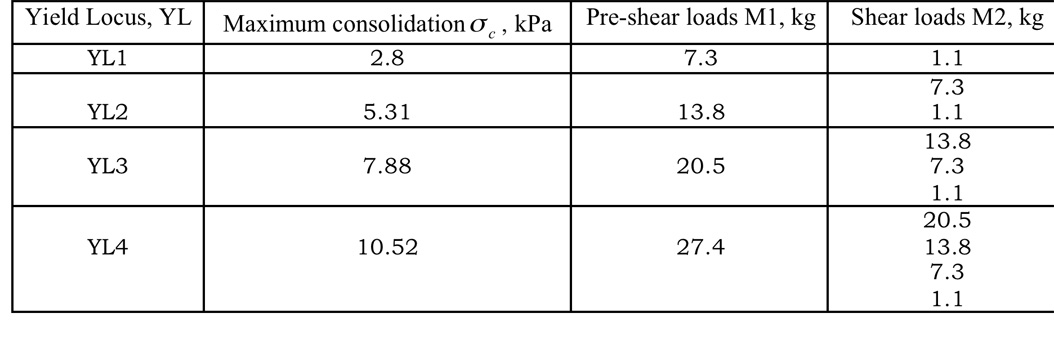

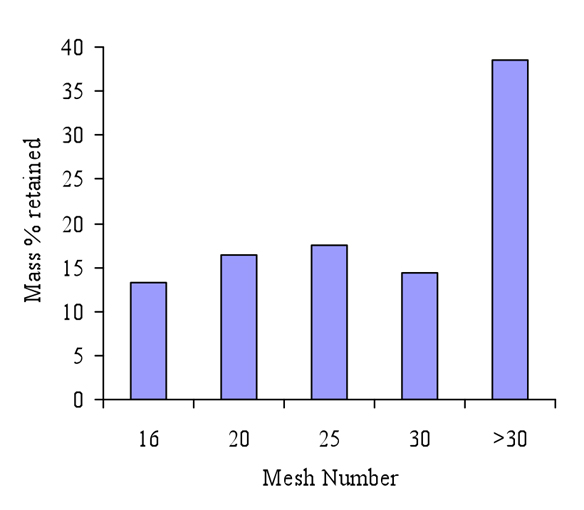
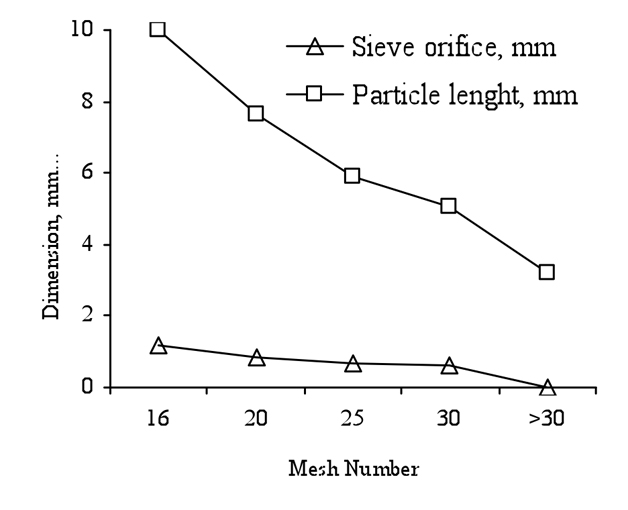
Figure 2a and 2b: Size distribution and particle length for experimental samples
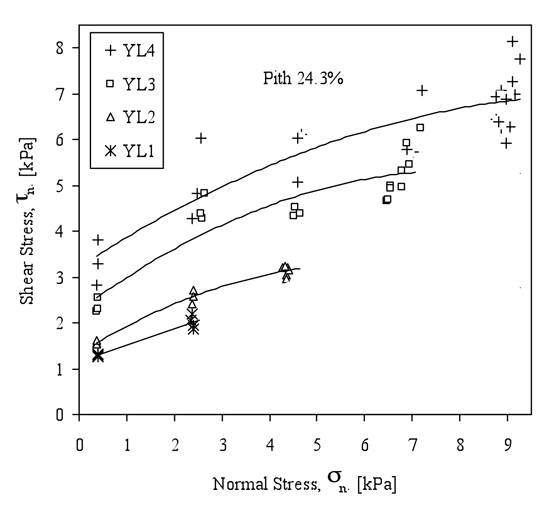
Figure 3: Yield locus for 24.3 % moisture content
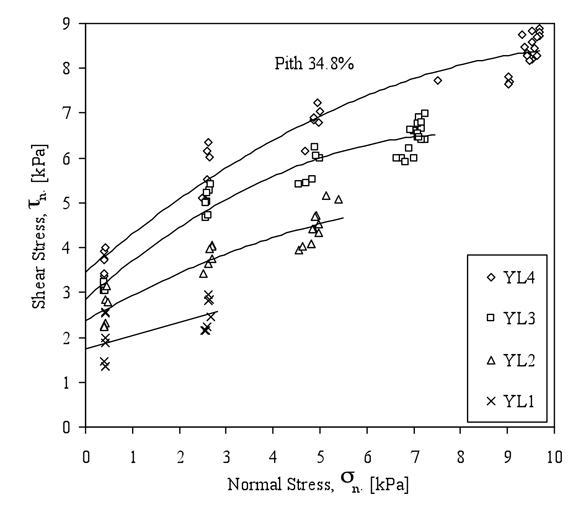
Figure 4: Yield locus for 34.8% moisture content
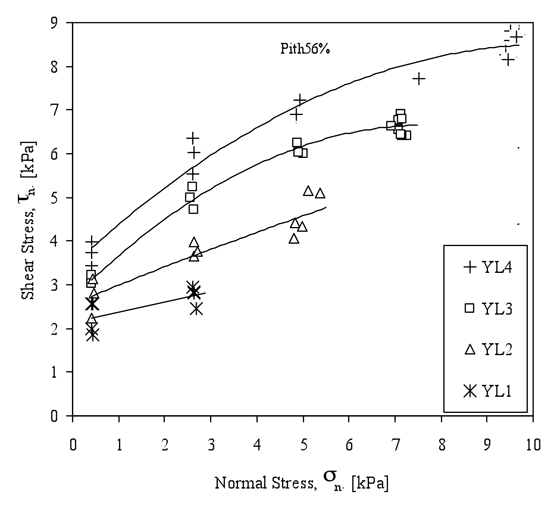
Figure 5: Yield locus for 56.0 % moisture content
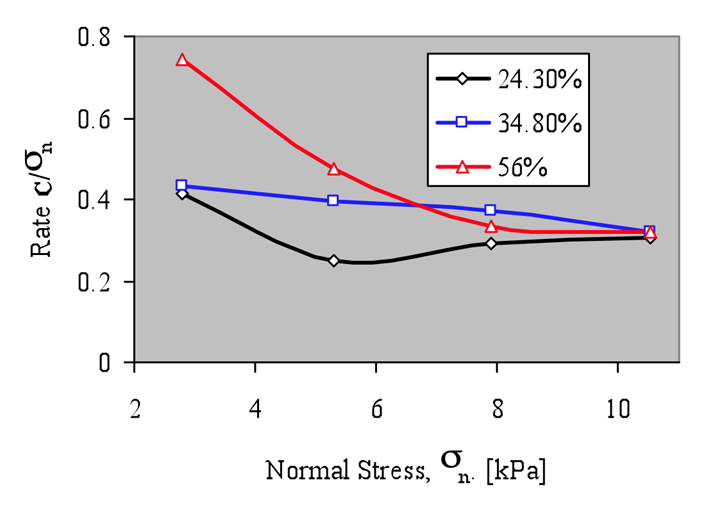
Figure 6: Cohesion change with the increase in normal load
Table 2: Flow properties for sugarcane bagasse pith
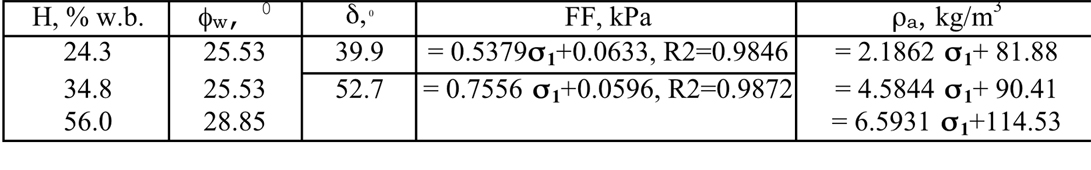
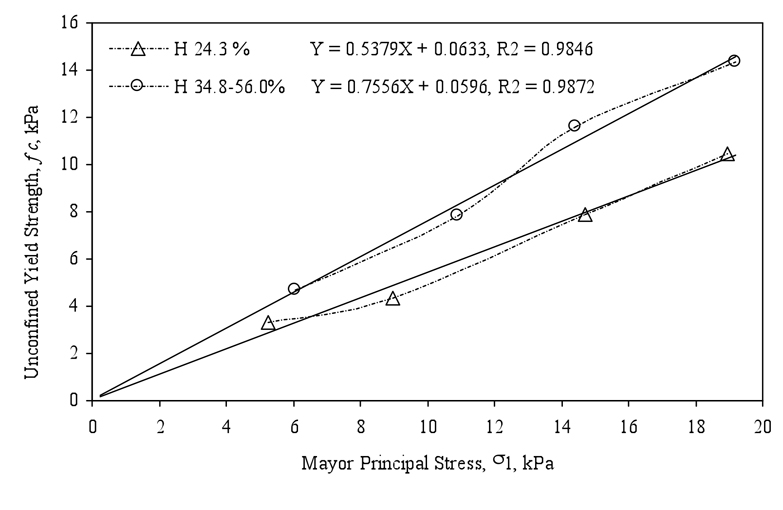
Figure 7: Flow function for sugarcane pith
A. Escamilla-Martinez, L. Velez-Jacobo, O. Barceinas-Sanchez
CIATEQ AC Advanced Technology Center.
Av. Manantiales 23-A, Parque Industrial B. Quintana.
76246 El Marqus, Qro. Mex.
E-mail: aguesc@ciateq.mx
Abstract
This paper presents a methodology for measurement and the findings about flow properties for non-spherical particles from wet sugarcane bagasse, using a modified direct shear device. The results for the flow function, FF, and effective angle of internal friction,, showed significant difference between 24.3% and 34.8% moisture content, and non-significant differences between 34.8% and 56% moisture content with the next data: FF(24.3%)=0.53791+0.0633 kPa, FF(34.8 % & 56%)=0.75561+0.0596 kPa, (24.3%) = 39.9o and (34.8 % & 56%) = 52.7o. The wall friction angle w, for sliding the sugarcane bagasse over stainless steel was 25.53o, for 24.3 and 34.8 % moisture, and 28.85o for 56.0% moisture. The results show a material classified as a very cohesive with 1.32
Key words: Sugarcane bagasse, shear stress, flow properties
1. Introduction
The agricultural residues used as animal feed, fuel or as natural fibers for biocomposites, commonly are disposed of in shredded form, such as the sugarcane bagasse fiber produced in sugarcane factories after extracting juice from the stalks. This bulk solid is composed of individual non-spherical particles; each one is thin, long and rough and also has low density, high compressibility, wide distribution of particle size, and high interlocking tendency. These properties make physical and mechanical characterization difficult, like the flow properties [1], which are useful in hopper design for free flow, mainly for cohesive bulk solids. Common devices for flow properties measurement used in powders or granular solids are inappropriate for sugarcane bagasse pith, mainly because of the particle size and the small strain rate before obtaining a true failure [2, 3, 4]. Internal shear test carried out on natural sugarcane bagasse, shows severe particle interlocking in a rotational device and typical direct shear device used for internal strength measurement [5, 6]. Using a modified direct shear device designed for this purpose, it was possible to obtain a true shear over a horizontal failure plane [7, 8]. The methodology used for the characterization was similar to the Jenike procedure [9]. These properties are based on an internal shear test carried out in a bulk solid sample, which determines the points of normal and shear stresses taking place in a failure plane. Analysis of the tests provides the following information: the flow function, FF; the effective angle of internal friction, ; the wall friction angle, w; and the apparent density function, a.
2. Materials and Methods
The analyzed bulk solid was sugarcane bagasse pith, obtained by forcing natural sugarcane bagasse through a 12-mesh sieve [10]. The particulate distribution was determined by sieving the sample on meshes 16, 20, 25, and 30, and the average length was obtained as suggested by Olivares et al [11]. The moisture contents were achieved artificially by water addition at three levels: 20-25 %, 35-45 % and 55-61%. After rewetting, the samples were stored in a hermetic plastic bag for 48 hours. The exact moisture content was determined by drying a sample for 24 hrs, as suggested by ASAE Standard S358.2 for Moisture Measurement for Forage, [12].
Shear test
The shear test determines the shear strength of a bulk solid, which is defined as the force required to slide a layer of material over another layer in the same sample. Several shear tests define a Yield Locus, YL, related to a specific maximum consolidation state for cohesive bulk solids. The device to determine this strength for sugarcane bagasse pith includes two square boxes, each one constructed of 20 mm thick carbon steel, 100 mm deep and 160 mm inner width; the upper box slides over the fixed lower box [7], Figure 1. The device includes two separations, 10 mm on one side in the upper box, and 10 mm on the other side of the lower box. These separations allow a high strain rate of the sample on the shear direction, which results in a true horizontal failure plane. The top box has a bracket to apply a load, F, and is provided with a load cell; a displacement sensor is also included. Before each test, a test without sample is carried out in order to determine the sliding force, Ff, between the upper and lower box. After that the sugarcane bagasse pith sample is manually charged into the boxes and loaded vertically with a mass M1, a hydraulic actuator, applies the horizontal force, F, to the bracket (50 mm/min), and the shear test starts; simultaneously the displacement sensor moves. The increase in the horizontal load and the upper cell displacement are continuously displayed on a chart and the data stored in a text file. The display shows the maximum internal shear just when the horizontal force begins to decrease or keep a steady state; at this moment the test is stopped and the pre-shear condition is obtained [13]. The test continues after removing some amount of mass, in such a way that M2
Yield locus and angle of internal friction
The yield locus (YL) is a straight or curved line composed of points (n, n), inclined at an angle of friction, , from the normal stress axis, , and intersecting the shear stress axis, . The intersection defines a value equal to the residual shear strength at zero normal load, C, which is called cohesion. This function is associated with a maximum consolidation state, c, [4, 14, 15], for cohesive bulks solids. The non-cohesive materials, have a unique YL and = .
In the present study case, each YL was obtained from three individual functions, using four maximum consolidation loads, M1, related to c for pre-shear conditions, and from one to four additional loads, M2, related to n for shear conditions, as show in Table 1.
Each YL was adjusted to a quadratic or linear equation and the angle of internal friction was computed by obtaining the slope of the line tangent to the equation at the intersection point with the vertical axis.
Effective angle of internal friction, d
The relationship between surface yield locus size and the mayor principal stress s1 during flow is described by the effective yield locus, EYL, and defined entirely by the effective angle of internal friction, d. Then this angle is described by the Shield-Jenike function as [13]:
For each YL equation the slope line tangent to the preshear condition point (mayor condition load for YL) was obtained and the radius of the Mohr Circle determined in order to compute s1 an s2. Later, the Shield-Jenike function was used to obtain d.
Flow function
The flow function, FF, is the main property of bulk solids and represents the ability of the granular material to flow freely by gravity when it is stored in a hopper. Basically it is used in the prediction of flow-no-flow conditions for evaluation of a given hopper design [16]. FF is a relation between the mayor consolidation stress, 1, and the so-called unconfined yield strength or internal strength fc, achieved by the solid because of the first stress. If a particular yield locus is known, the internal strength, fc, will be found when drawing a semicircle tangential to the yield locus, YL, and passing through the origin as described by Jenike et al [13]. For each YL there is one pair of points (1, fc), and therefore, each moisture content state of sugarcane pith provides several pairs of such points. The plot of these points is a flow function, which is related to one specific moisture content and particle size distribution.
Wall yield locus and wall friction angle
The test procedure and equipment is the same as for the shear test. The device arrangement for this purpose involves the installation of a stainless steel shell between the upper and lower cells. The tested material slide over the shell, hence in this case, with only one sample it is possible to obtain a complete wall yield locus, WYL, composed of pair of points (n, nw). The wall yield locus slope is called the wall friction angle, w. Before carrying out the sliding test the volume change in the sample is measured, in order to determine the apparent density function, a.
3. Results and Discussion
The mass fraction distribution for sugarcane bagasse pith used in these tests is shown in Figure 3. The average length was 5.56 mm and the diameter 1.96 mm, and the general relation between these parameters is shown in Figure 4.
Twelve yield locus plots were obtained, for three moisture contents. At first sight, there is a similar shape for different yield locus at the same consolidation state, mainly for the moisture content ranging from 34.8% to 56.0%. The typical values for cohesion and internal friction angles are from 1.1 to 4.0 kPa and 19.6 to 27.7o respectively. Yield loci for different moisture content are show in figures 3, 4 and 5; in general, curved plots were observed.
On yield loci, it is shown that cohesion reduces as the normal consolidation increases, Figure 6. For typical low cohesive bulk solids, there is a no significant difference among different consolidation levels. The arrangement of the fiber when they are subjected to high normal loads makes the sliding and the shear process easy. A similar behavior is shown for pith with 24.3% and 34.8 % moisture contents, and a large difference is shown for 56% moisture content. An interesting case is the material with 34.8%, because the difference is less pronounced with the increase in the normal stress. The differences are attributed to the low flexibility of the pith particles with low moisture content (24.2%) and the high flexibility of the particles with high moisture content (56.0%). Typical values of C/n for flour at 10%, is 0.03 with a normal stress of about 20 kPa [3]. The best information for flow properties are obtained for values no greater than 1.
Because of the similitude observed between plots associated to the contribution of the normal load to the cohesion at different moisture content, a statistical mean comparison was realized for the same maximum consolidation state and different moisture contents. The results showed the statistical difference between material with 24.3% and 34.8% of moisture content, but similar behavior between 34.8% and 56.0%. So, the final flow properties measured for sugarcane pith are shown in Table 2. The main difference among them related to the flow function, FF, is the mayor internal strength for high moisture content, as the highest principal stress increases, Figure 10. This means better flowability for dry pith, than wet pith, although the internal strength when 1 = 0 is almost equal. But in general, this material is classified as very cohesive [17], with h=1.85 for 24.3% moisture content and h= 1.32 for 34.5 to 56 % moisture content.
3. Conclusions
This work describes a general methodology to characterize fibrous bulk solids, such as natural sugarcane bagasse and sugarcane bagasse pith, for practical applications in hopper design to achieve free flow conditions. Using this technique, it is possible to measure the flow properties for a low density particulate material composed of non-spherical particles, using a modified direct shear device. The best agreement among the results is observed for pith with 24.3 and 34.8 % moisture content with a greater difference for 56%. The aforementioned is due to the high moisture content, causing great flexibility of particles and promoting high interlocking between the, during the shear testing and during flow condition. Also, the high moisture content promotes sticking problems between the pith and the hopper or bin walls. In general, the tested material is classified as very cohesive and for design purposes it is not convenient to apply the results for hopper designs when moisture contents are higher than 34.8 % w.b.
References
[1] Johanson, A. and Colijn 1964. New Design Criteria for Hoppers and Bins. IRON AND STEELL ENGINEERING, Copyright, Association of Iron and Steel Engineers, pp. 84-104.
[2] Jenike, A.W. 1954. Flow of bulk solids. UTAH Eng. Experiment Station, Bulletin 64. Salt Lake City. Utah, USA.
[3] Kamath, Vierenda & Manbeck. 1993. Flow properties of powders using four testers – measurement comparison and assessment. Powder Technologoy, 76 (1993) 277-289 Elseveier Sequioa.
[4] Schwedes, J. 2000. Tester for measuring flow properties of particulate solids. Powder Handling Processing, Vol 12. No. 4. Germany. ISSN 0934-7348.
[5] Bernhardt, W. 1998. Handling Properties of Sugarcane Bagasse: II Bulk Properties. Zuckerindustrie, 123 Nr. 6, pp.428-432
[6] Escamilla-Martinez, A. 2000. Flow properties measurement for agricultural shredded residues. Paper No. 0142, Annual ASAE Meeting. Milwauke, Il. USA. ASAE. Niles Rd. St. Joseph, MI 49085-9659 USA.
[7] Escamilla Martnez, De la Torre-Alcocer. 2001. Dispositivo para la determinacin de propiedades mecnicas de residuos agrcolas desfibrados a granel. Simposio 2001 La Investigacin y el Desarrollo Tecnolgico en Quertaro. Qro. Mx. ISBN 968-5402-06-X.
[8] Escamilla Martinez A. 2002. Caracterizacin de las propiedades de flujo de materiales fibrosos a granel y su aplicacin al diseo de tolvas. Doctoral dissertation, CIATEQ, Qro. Mx.
[9] ASTM-D6128-97. 1997. Standard Shear Testing Method for Bulk Solids Using the Jenike Shear Cell. ASTM Committee D-18 Soil and Rock and D18.24 Characterization and Handling of Powder and Bulk Solids.
[10] Correa J.L. 1982. Sistemas y equipos de desmedulado en la industria del bagazo de caa de azcar. ICIDCA, Ed. Cientfico-Tcnica. La Habana, Cuba.
[11] Olivares, E. & Brossard E. 1998. Proximate Analysis and Particle Size of Sugarcane Bagasse and Trash. Paper No. 986011, ASAE Annual International Meeting, Orlando FL.
[12] ASAE S358.2 DEC93. 1993. Moisture Measurement – Forages. ASAE Standards 1998, Standards Engineering Practices Data. ISBN 0-929355-92-X
[13] Jenike, A., Elsey, P., Woolley R. 1960. Flow Properties of Bulk Solids. Proc. Amer. Soc. Test. Mater. 60:1168-1181.
[14] Jenike, A. 1958. Flow of Bulk Solids. UTAH Engineering Experiment Station, Bulletin 96. Salt Lake City, Utah.
[15] Walker, D.M. 1966. An Approximate Theory for Pressure and Arching in Hoppers. Chem. Eng., Sci. 28, Vol 21, pp. 975-997.
[16] Jenike & Leser. 1963. A flow-no flow criterion in gravity flow of powder in converging channels. IV International Congress on Rheology.
[17] Schulze, D. 2002. Understanding and measuring powder flowability. Dietmar Schulze Schuttgumesstechnik, Am Fort 20, D-38302 Wolfenbuttel, Germany.